Monthly Sales Report Format
Download Monthly Sales Report Format to analyse your sales data. Or use the Vyapar App to check your Sales report, Purchase report, and P&L Report easily and run your business effortlessly!! Avail 7 days Free Trial Now!
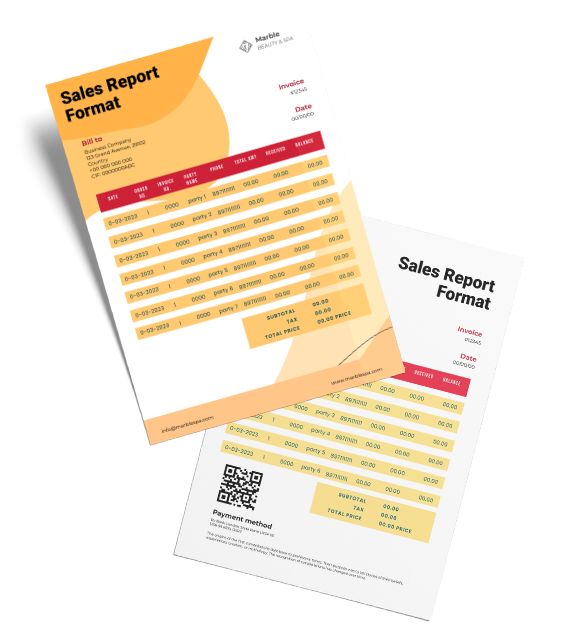
Highlights of Monthly Sales Report Templates
We’ve put in a lot of effort to make sure you get the best template possible

All versions are print friendly

Built From scratch

Include essential invoice elements

Automatically calculate subtotal & grand total amount

Consistently formatted
Download a Free Monthly Sales Report Formats
Download professional free monthly sales report formats, and make customization according to your requirements at zero cost.
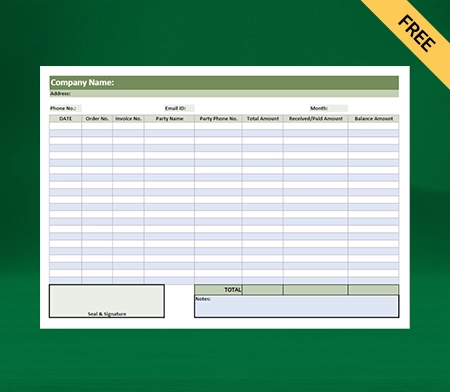
Monthly Sales Report Format – 1
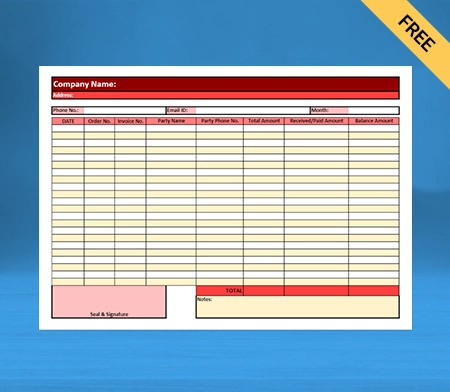
Monthly Sales Report Format – 2
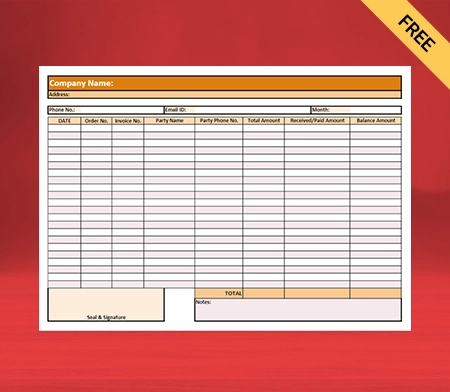
Monthly Sales Report Format – 3
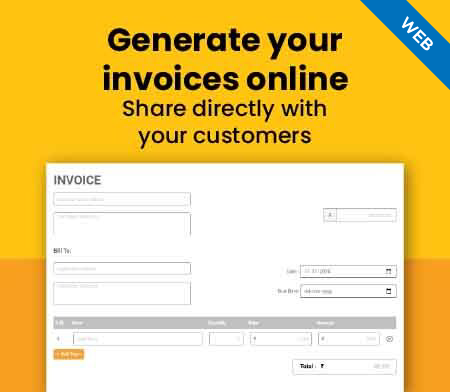
Generate Invoice Online
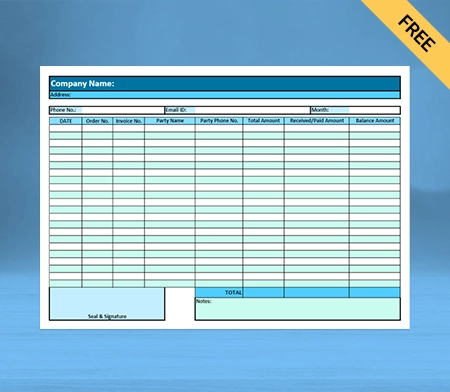
Monthly Sales Report Format – 4
What is a Monthly Sales Report?

A monthly sales report summarises the company’s sales activities for every month. A sales report serves as your company’s compass and road map, guiding your sales team in the right direction. It depicts the performance of sales representatives and reflects various sales processes used by the company.
It also displays trends in sales volume and compares data from various sales funnel steps. Business owners can evaluate a sales team’s performance and areas for improvement using a monthly sales report. A good business will have a good product, but without a sales team to bring in new customers, this product will find it challenging to make money.
Reporting also concentrates on sales representatives’ performance throughout the entire sales cycle, from lead generation to deal closure. Each report is a snapshot that your business can use to evaluate the situation, choose the best course of action, and make decisions. A sales manager can use a sales rep to focus on the parts of the business where they can add the most value.
It is possible to track trends and base decisions on data rather than specific instances or actions by creating a monthly sales report. This data-driven strategy offers a more comprehensive view of the business’s internal operations and gives a rundown of each team member’s actions.
How to Write an Effective Sales Report?

Set a Goal
Sharing a weekly report with the sales team differs from presenting a monthly sales report to senior management. Both scenarios call for a different approach because they target different audiences.
The audience you’re presenting to will determine the goal of your sales report and the information that would be most pertinent to them. So, before writing the sales report, clarify the purpose and decide what you hope to accomplish.
Define a Timeframe
The ability to present a more precise and detailed picture is made possible by clearly defining a timeline. Additionally, it becomes simpler to draw logical conclusions, analyse trends, and compare.
For instance, there is no need to look at data from the beginning of the year if you are working on a monthly report. Instead, concentrate on analysing the sales activity for that particular month using a monthly sales report format.
Assemble Pertinent Data
You must collect the pertinent information for your sales report once you have established the objective and deadline. Verify your sales data’s accuracy because a lack of it will undoubtedly affect your analysis and reporting.
Here are a few crucial sales KPIs you can mention:
- Calls placed.
- Leads produced.
- Lead response period.
- Deals Closed.
- Deals Closed.
- The money earned.
- Deals are closed by each sales agent
Therefore, it’s a good idea to maintain data hygiene by conducting routine audits and eliminating inaccurate or out-of-date data.
Display Data Graphically
Even though sales is a numbers game, you can’t just throw some numbers together and call it a sales report. It’s crucial to use numbers to illustrate a point and to present them visually so that viewers are interested. Visuals are compelling because they convey information without tiring the reader.
Use infographics, graphs, and charts as data visualisation tools to present data visually. It simplifies understanding information, spots trends and highlights important points. Line graphs, for instance, can be used to show monthly sales pipelines, and pie charts can show monthly sales channels.
Present Your Analysis
Your subordinates or managers want to know your interpretation of the data presented. To locate gaps in the sales process and unearth opportunities, analyse sales performance, evaluate patterns, and make comparisons. For readers to understand and relate to the report, providing context for the data you present and explaining its origin is crucial.
Write a Summary
A brief, one-page summary of the monthly sales report gives readers an idea of what to expect. This section will emphasise the timeline and the report’s main points. Text-heavy summaries are not required.
It is beneficial to present a thorough report to senior management or top-level executives, who typically don’t have the time to read the whole thing. While maintaining a consistent colour scheme, consider using visuals to present it and grab attention.
Finish With a Plan of Action
The most valuable reports offer an action plan based on an analysis of the sales performance. For instance, if your sales are declining, it’s crucial to state a specific action plan that outlines your weekly strategy and how you intend to boost sales.
Therefore, put a sales strategy at the end of your sales report to close the gaps and loopholes. It demonstrates your initiative and enables you to hold your team members accountable and efficiently track progress.
Advantages of Making Monthly Sales Report
- A monthly sales report makes it simpler to determine the profits made by each product by tracking revenues, allocating costs, and analysing sales.
- Using the monthly sales reports information, you can market the products with the best future expansion prospects. You can optimise your sales and marketing initiatives with its assistance.
- Your company’s most profitable product or service can be determined using the annualised aggregate from the monthly sales report data.
- When it’s time to scale your team, it will be beneficial to review your sales metrics. You can confidently scale your sales team by analysing your monthly sales data to strengthen and improve your sales process.
- Sharing and displaying your monthly sales data will encourage wise cross-departmental business decisions. When the company has access to routine sales data analysis, it can make better decisions for the future.
- The monthly sales report on overall sales can assist you in locating your sluggish merchandise. You can lower holding expenses, prevent overstocking, and exercise better resource management. You can also alter prices or introduce product discounts using this information.
- The monthly sales report helps identify the customers who will bring in the most money. If you want to raise customer loyalty and your customer retention rate, use this invaluable information. Your loyal customers are more likely to return if you implement VIP-style services, discounts, and bonuses.
- A monthly sales report helps you spot opportunities or potential issues by displaying trends or patterns in your sales data. If sales of a particular item are rising, you can ensure that the inventory is kept accurately across all distribution channels.
Create your first sales report with Vyapar App
Types of Sales Reports
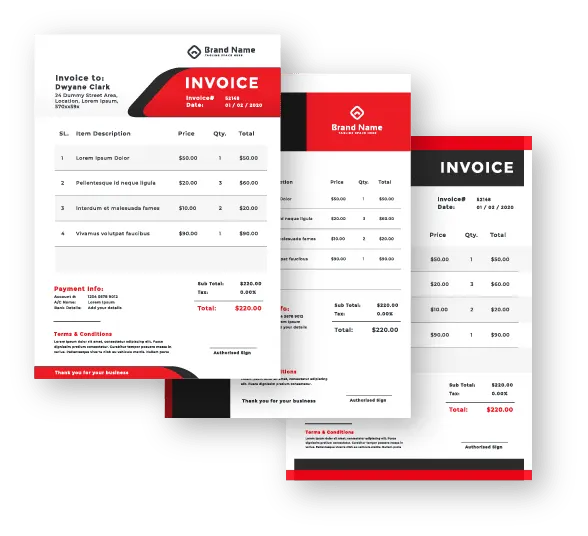
Here are different monthly sales reports you can create monthly to help your business make wise decisions.
Conversion Rate Report
There are several steps in turning a lead into a paying customer. You gain some and lose some at each stage. These incremental victories are measured by conversion rate.
Out of the total, it tells you how many leads move on to the following stage. Therefore, a conversion rate report is crucial for your sales teams.
Average Deal Size Report
The typical deal size report and your report card from school are very similar. Each deal’s score, or sales revenue, is added and divided by the total number of sales. Similar to how our report card calculated our percentage by averaging our scores.
Because it enables you to set reasonable goals and milestones for your sales cycle, the deal size report is necessary for any sales team. It also instructs your sales representatives to set a conversion goal. They are fully aware of the number of deals they must close to reach their goals.
Average Sales Cycle Length Report
The average sales cycle refers to the typical time it takes a representative from the initial contact to the actual purchase. The ideal sales performance monitor is the average monthly sales report. You can quickly identify the report’s top, average, and below-average performers by comparing the individual with the overall team average.
Using this knowledge, you can motivate the top performers to perform even better while providing better training for the average and struggling performers. To determine whether your sales process is lagging, you can also compare your company’s monthly sales to the industry average.
Report on Won and Lost Deals
You can’t win them all in sales, which is a well-known fact. The difficulty, though, is in understanding the causes of each success and each failure. You can interpret that with the aid of the Won and Lost Deals Analysis Report.
It compares the won and lost deals to various factors, including company size, competitor involvement, and lead source, to show you what worked and didn’t work in multiple situations. Using this knowledge, you receive a list of dos and don’ts for your sales representatives.
Report on Customer Experience
Acquiring a customer is not the end of the sales process. Getting new clients is just as important as keeping current ones. You must always take into account the clients who leave you. The monthly sales report formats can help you analyse sales data with timely reports.
A report on customer churn takes care of that. It not only reveals how many customers have stopped doing business with you, but it also examines how it has affected revenue. You can then set more precise sales goals to compensate for your losses.
Sales Call Report
A sales call report tracks the number of calls and follow-ups made to a customer. Additionally, it logs crucial customer acquisitions from the call. Using a monthly sales report format by Vyapar, you can create sales call reports and analyse them.
It is where you can find data insights about a customer’s “propensity to buy,” which is a piece of information that sales executives highly value. They can prioritise accordingly by knowing which customers will most likely convert soon.
Revenue Report
Every company prepares a revenue report. It is a straightforward comparison of the highest revenue to individual revenue. This report tells you the truth about each person’s contribution, progress toward their goals, and revenue targets. Thus, you know precisely where to exert pressure to obtain better outcomes.
However, a revenue report should never serve as your only source of information regarding the effectiveness of your sales team. To better understand the situation that affected the revenue results, you should analyse it in conjunction with other reports.
Why Vyapar App is a Better Alternative to Monthly Sales Report Format
Easy and Saves Time
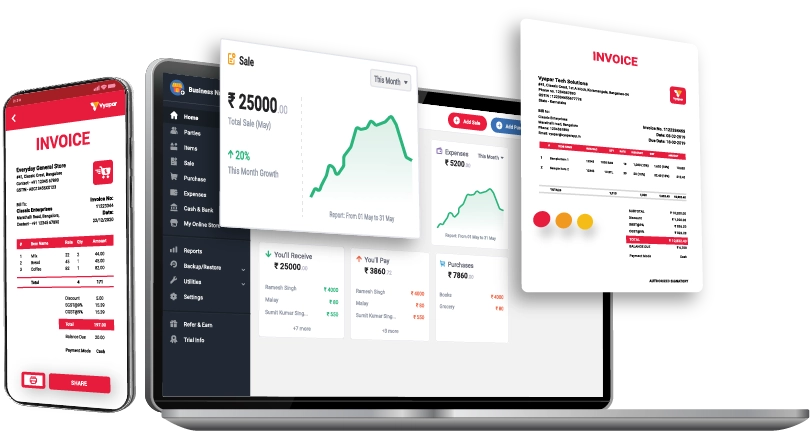
The monthly sales report formats don’t require thorough accounting knowledge for implementation. The use of the sales report formats is made simple by the app’s user-friendly design.
Manual bookkeeping takes a lot of time and is error-prone. Automation speeds up the process and gets rid of human error. It sends reminders, collects payments, and pays off debts to avert future issues.
The Vyapar monthly sales report generator app automatically keeps track of your transactions, including debit and credit notes. Reviewing the reports and analysing your business takes little time or effort.
Lifetime Free Basic Usage
You can easily create sales reports using our free GST sales report maker software. In addition, you can control your dashboard and keep track of inventory items.
The majority of the features in our business accounting tool are free to use. All of the free features are available forever to Android mobile users.
The accounting app is available from the Play Store for free download and registration. But a business can use a subscription to access expensive features and desktop applications.
Customisable Formats
The formats of the Vyapar monthly sales report are entirely customisable. To perfectly present your brand’s identity, you can include our company’s logo, style, font, and brand colours in your receipt.
The GST receipt generator aids in the creation of attractive sales reports and provides comprehensive information about your clients’ transactions.
Your company can differentiate itself from the competition with a fully customised format. With the help of a customisable monthly sales report format, you can include the needs of your business when creating a report.
Data Safety and Security
Data security is now the primary concern of every business owner. By using our sales report generator app in India to set up an automatic data backup, you can safeguard the data in your app.
Regularly performing secure backups or configuring automatic backups using the free billing app are two ways to guarantee your company’s security.
You can set up an automatic data backup in the Vyapar monthly sales report maker app to safeguard the privacy of the information.
Multiple Payment Options
Give your customers the option to pay using the payment method of their choice. A single QR code can accept all payment methods.
Customers can make payments with cash, a credit card, a debit card, UPI, NEFT, RTGS, QR codes, e-wallets, options for deferring payment, and other means.
Customers value convenience, and the most significant measure of comfort you can give them is letting them choose how they want to pay.
Valuable Features of the Vyapar App
Business Reports
The Vyapar accounting software comes with expert monthly sales report formats. To create 40+ business reports that meet all of your needs, use our free billing software.
You can export the reports in Word, Excel, and PDF formats, greatly enhancing the operational effectiveness of your business. Users can easily view and analyse the information in the monthly sales reports.
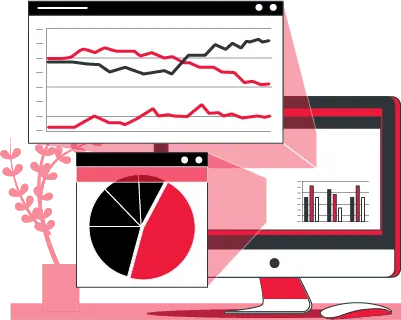
You can create graphical reports with the app to monitor sales and expenses. Vyapar helps you analyse the company’s profit and provides accurate business information, accounts, and many other things.

Cash Flow Management
Your business requires accounting software that satisfies all of your requirements. Using Vyapar, you can keep an eye on your current payables and receivables.
Your business’s cash flow ensures you have enough money to keep things running. The dashboard can show how easily you can cover ongoing costs without missing EMI payments.
Businesses can keep track of transactions using monthly sales report data stored in a database. It facilitates tracking payments. Managing cash flows is essential for many business operations, including billing and accounting.
Receivables and Payables
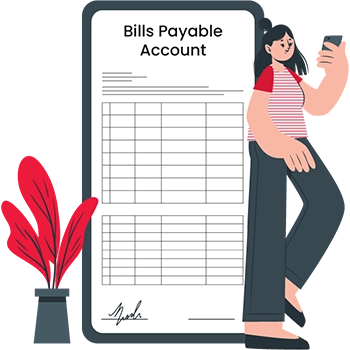
Users can track their company’s cash flow in real-time by saving all transaction data in our monthly sales report format. The software can track both the party’s payables and receivables.
Using the app’s business dashboard, you can track the money you need to receive and pay. It won’t take you long to identify the perpetrator. You can set up payment reminders via email, SMS, or WhatsApp.
Using the bulk payment reminder feature, you can save time by reminding all of your customers to make payments at once. The Vyapar software generates GST sales reports monthly and can carry out the necessary calculations.

Track Inventory
Utilise the monthly sales report maker app to set up low inventory alerts for each item. You can save time by updating the ingredient availability and giving a list of low-quantity stock items.
You can also place pre-orders based on monthly sales reports to best use your inventory space. For orders to be completed on time, the ability to track them is essential. Tracking helps in preventing pointless losses.
With the time they save staying on track, sellers can finish other daily tasks. As a result, customer satisfaction increases. Businesses can streamline their tracking processes with the aid of these features.
Regular/Thermal Printer
With the Vyapar monthly sales reports format, you can print the generated reports in minutes using a thermal or traditional (laser) printer. Plug in your regular or thermal printer or pair the app with a Bluetooth device to start printing invoices.
The availability of thermal paper sizes 2″ and 3″ and other custom paper size options gives you a better chance of quickly producing prints in all appropriate sizes, including standard paper sizes A4 and A5.
Using the Vyapar printing bill maker app, you can make expert sales reports monthly and send them to your clients. You can print it out for your clients, fully customise it, and choose from various Excel, Word, or PDF formats.
Are you a Business Owner?
Take your business to the next level with Vyapar! Try free for 7 days
Try our Android App (FREE for lifetime)
Frequently Asked Questions (FAQs’)
A monthly sales report offers a more comprehensive view of sales performance. The monthly sales report templates can focus on the performance of specific products or sales representatives or offer a summary report for a sales team or an entire company.
Steps to writing a monthly sales report:
1. Set a goal
2. Define a timeframe
3. Collect relevant data
4. Illustrate data visually
5. Present your analysis
6. Write a summary
7. End with an action plan
1. Identify the report’s target audience and goal.
2. Choose a specific time frame
3. Collect relevant data.
4. Describe the data.
5. Make it appealing.
You can download our monthly report template in Word, Excel, or PDF. Update your name, the project’s name, the month the report covers, and the date you wrote the report in the report template’s header.
After that, review the monthly checklist again and note any potential threats to the deadlines, resources, or other issues. List every assignment that your team finished during the month. Take notice of the ongoing activities. List the tasks that need to be completed before the project is finished.


