Sales Report Format in Excel
Download the Sales Report Format in Excel to analyze your sales data. Or use the Vyapar App to check your Sale report, Purchase report, and P&L Report easily and run your business effortlessly!! Avail 7 days Free Trial Now!

Sales Report Invoice Format Vs Vyapar App
Features
Format

200+ Professional Formats
Sale Reports
Auto Calculation
User Activities
Accounting Integration
Auto Backup
Real-Time Business Insights
Multiple Payment Mode
Free Support and Assistance
Instant Data Sync
Download Free Sales Report Format in Excel
Download professional free material reconciliation templates, and customize according to your requirements at zero cost.

Sales Report Format in Excel – 01

Sales Report Format in Excel – 02

Sales Report Format in Excel – 03

Sales Report Format in Excel – 04

Sales Report Format in Excel – 05

Sales Report Format in Excel – 06

Sales Report Format in Excel – 07

Sales Report Format in Excel – 08
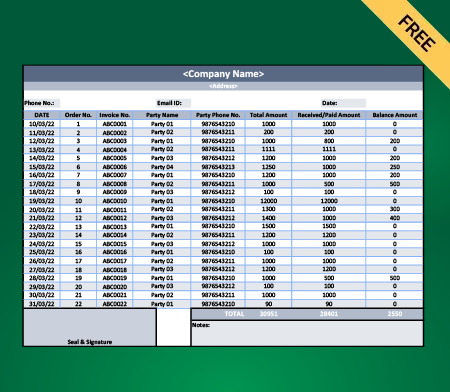
Sales Report Format in Excel – 09
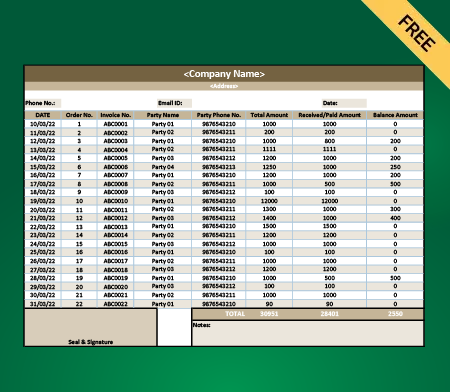
Sales Report Format in Excel – 10
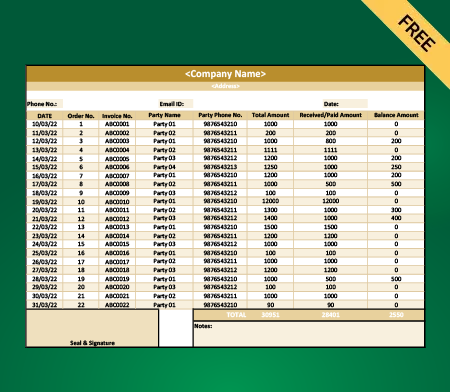
Sales Report Format in Excel – 11
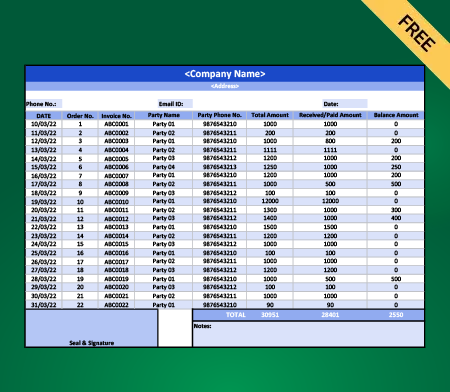
Sales Report Format in Excel – 12
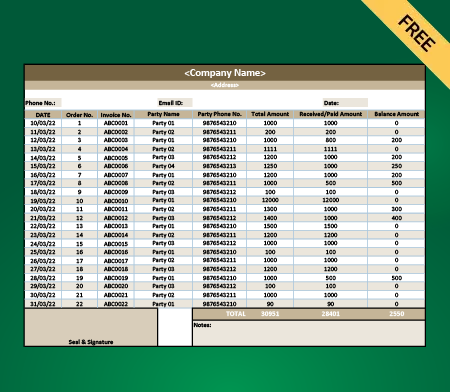
Sales Report Format in Excel – 13
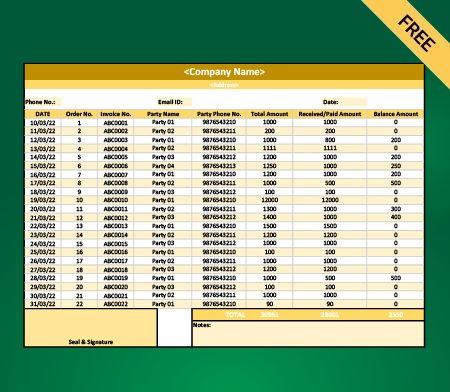
Sales Report Format in Excel – 14
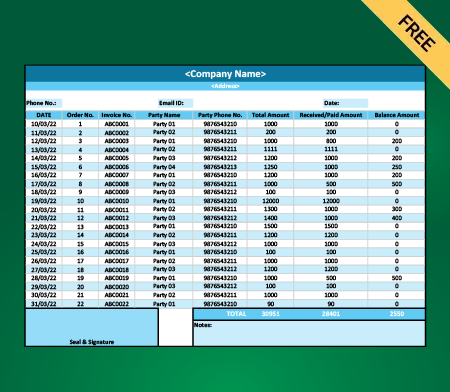
Sales Report Format in Excel – 15
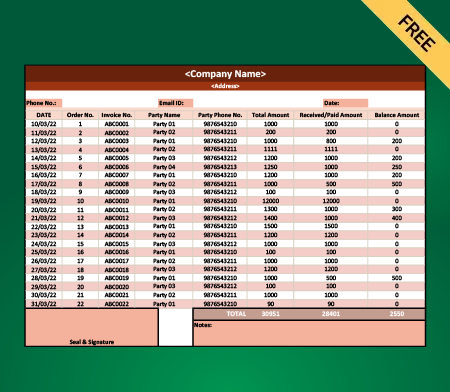
Sales Report Format in Excel – 16
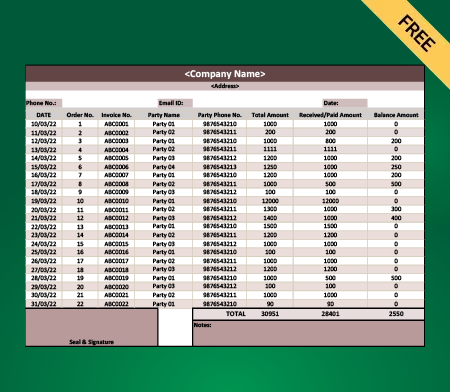
Sales Report Format in Excel – 17
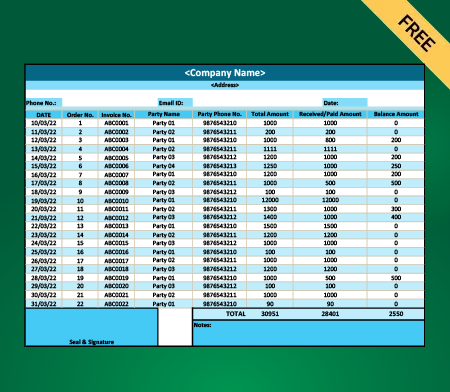
Sales Report Format in Excel – 18
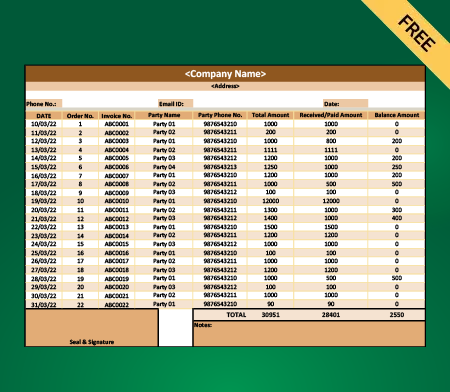
Sales Report Format in Excel – 19
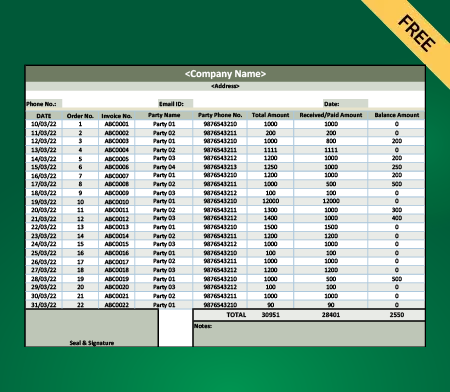
Sales Report Format in Excel – 20
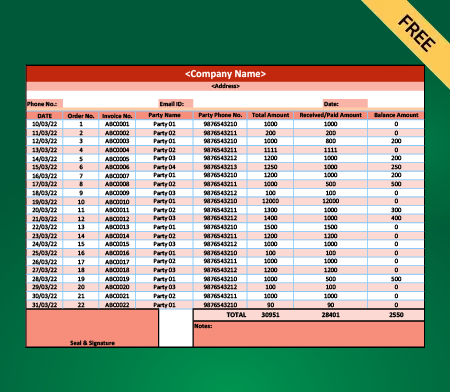
Sales Report Format in Excel – 21
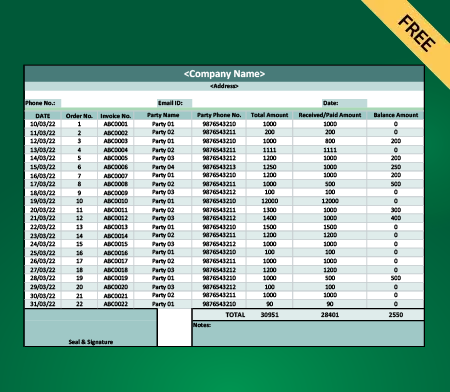
Sales Report Format in Excel – 22
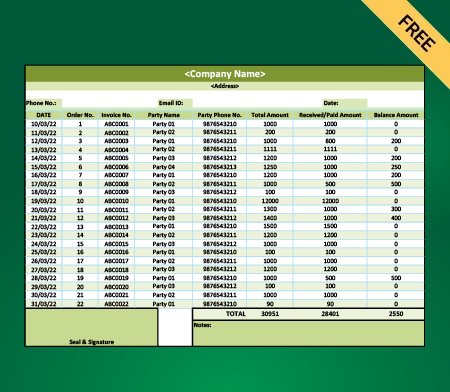
Sales Report Format in Excel – 23
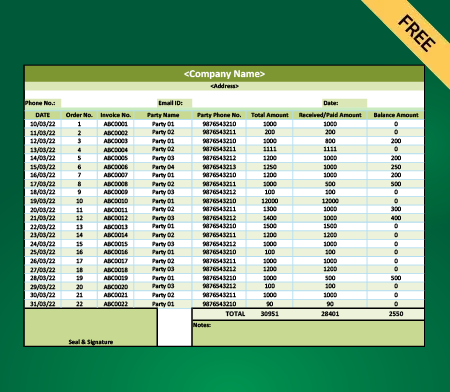
Sales Report Format in Excel – 24
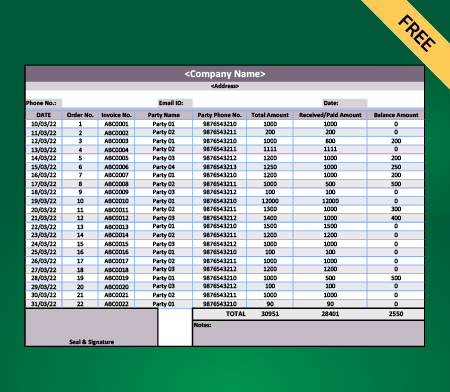
Sales Report Format in Excel – 25
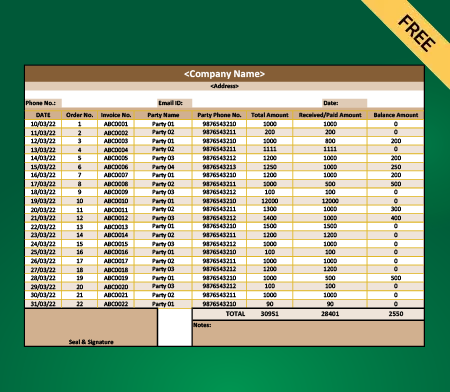
Sales Report Format in Excel – 26
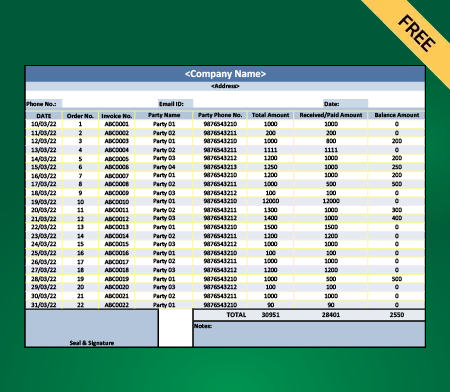
Sales Report Format in Excel – 27
What is a Sales Report Format in Excel?

A specific sales report format in Excel is a valuable tool to track and measure your company’s performance when selling products or services. These formats are not pre-designed rigidly but can be tailored to match a company’s unique goals and requirements. The sales report format in Excel proves equally beneficial for small businesses, large organizations, and entrepreneurs.
By tracking your sales, you can uncover specific trends and patterns. Recognizing these patterns simplifies the process of creating practical strategies and setting company goals. A sales report format in Excel also enables you to monitor employee performance, forecast future numbers, and evaluate the success of your marketing campaigns. Additionally, these sales report formats are incredibly easy to use, saving both time and money.
Benefits of Using the Sales Report Format in Excel
While you can always use the above method to create your sales report format in Excel, it is optional, especially if you manage a larger sales team. Instead, you can choose Vyapar’s ready-to-use Sales Report Format in Excel. Simply input the values into these formats and start using them. Here are some benefits of using these templates by Vyapar:

Better Time Management
Even if you repeat the above process multiple times, it will still take at least half an hour to prepare. This time is only for compiling individual sales figures. Now, imagine doing that for all your sales reports every day. You need these reports for everything, including objectives, sales transactions, and desired business results.
Instead of creating everything point by point as described above, you can opt for Vyapar’s ready-to-use Sales Report Format in Excel. These formats allow you to apply different styles to meet your varied requirements. This saves all the time you would otherwise spend manually entering data into Excel.
Even more time would be spent converting that Excel data into graphs to help you. The best part is saving all the time required to gather this data initially. As a sales team head, you can use this saved time for more productive operations.
Quicker and More Accurate Data Entry
Let’s face it. As mentioned above, Excel is not ideal for calculating sales data for people on the road. Excel offers limited mobility, particularly when it comes to manual data entry. However, using a sales report format in Excel enables quick and accurate data entry.
Your sales representatives who go door-to-door for face-to-face visits need better mobility. Vyapar’s ready-to-use formats provide that mobility. They are intuitive, easy to use, and can record sales data in just 10 seconds.
Otherwise, you would need to wait for hours until the sales team enters sufficient data into Excel sheets. So, switch to Vyapar now for a better and more accurate sales report.


Accurate Real-Time Data
Vyapar’s ready-made Sales Format in Excel also benefits from a high user adoption rate, creating a better knock-on effect.
Your on-field sales team can enter data immediately after a visit or call. They don’t need to wait until they return to the head office to input data under supervision. Data accuracy and quality are literally unmatched.
With Vyapar’s Sales Report Format in Excel, you can confidently create a 100% accurate sales report.
Improved Performance
With all the valuable details that sales reports provide, you can make better decisions regarding your sales performance. By analyzing the number of arrangements, you can determine which sales strategy worked in your favor and delivered results.
The areas requiring your attention can also be assessed more effectively. These efforts and assessments will help you achieve your objectives faster and more efficiently.
Additionally, your team’s performance will be clearly reflected in the report, enabling you to enhance the productivity of low-performing individuals. Using the sales report format in Excel by Vyapar improves the overall performance of your business management processes.

How Many Types of Sales Report Formats?

- Daily Sales Report: Delivers a snapshot of daily sales, including total sales, returns, and discounts, enabling businesses to monitor daily performance.
- Weekly Sales Report: Consolidates sales data over a week, making it valuable for identifying short-term trends and assessing the impact of marketing campaigns.
- Monthly Sales Report: Provides a detailed view of sales over a month, showcasing key metrics and comparing them against monthly targets.
- Quarterly Sales Report: Evaluates sales performance over a three-month period, supporting strategic planning and the achievement of long-term goals.
- Sales by Product Report: Breaks down sales data by specific products, enabling businesses to identify top-performing items and areas requiring improvement.
- Sales by Region Report: Analyzes sales data by geographical regions, helping businesses identify strong and weak markets.
- Sales by Salesperson Report: Assesses individual salesperson performance, highlighting their contribution to overall sales and supporting performance management.
- Sales Forecast Report: Predicts future sales based on historical data, offering insights for planning and setting achievable sales goals.
- Year-to-Date (YTD) Sales Report: Summarizes cumulative sales from the start of the year to the present, enabling comparison with previous years.
- Customer Sales Report: Highlights sales to specific customers, detailing purchase history and trends, helping businesses understand customer behavior and preferences.
What Does a Sales Report Template Need?

A sales report template should feature a clear title and date, specifying the report’s focus, such as “Monthly Sales Report,” along with the period it covers, like August 2024.
It should begin with an executive summary offering a brief overview of key findings and overall sales performance.
The report’s core will present sales data, including total revenue, units sold, and performance breakdowns by product, region, or salesperson.
To provide a comparative perspective, include analyses comparing the current period with previous periods and sales targets.
Highlight essential metrics like average deal size, conversion rates, and sales growth rate as key performance indicators (KPIs).
Use visual aids such as graphs and charts to represent sales trends and seasonal patterns effectively. The report should also highlight top performers, such as best-selling products and highest-performing salespeople.
Additionally, include insights into customer behavior, such as the proportion of new versus returning customers and any relevant feedback.
Address challenges or issues faced during the period and outline the actions taken or proposed to resolve them.
Finally, provide actionable recommendations based on the report’s findings, and, if necessary, attach appendices with detailed data, charts, and metric definitions for further reference.
How Do I Use the Template to Create Sales Reports?

To create sales reports using a template, follow these steps:
- Prepare Your Data: Begin by gathering all relevant sales data, including total sales, units sold, and performance by product, region, and salesperson. Verify that your data is accurate and up-to-date.
- Open the Template: Access your sales report template, whether in a spreadsheet or a report-building tool. Ensure the template is designed to capture all necessary data points.
- Enter Basic Information: Input the report’s title, date, and reporting period at the top of the template. This sets the context and specifies the timeframe being analyzed.
- Input Sales Data: Fill in the template with detailed sales figures. Include total revenue, units sold, and breakdowns by categories like product, region, or salesperson in their designated sections.
- Conduct Analysis: Analyze the data by comparing current sales performance with previous periods or against targets. Identify trends, strengths, and areas for improvement.
- Calculate KPIs: Determine key performance indicators (KPIs) such as average deal size, conversion rates, and sales growth to evaluate the effectiveness of your sales strategies.
- Create Visuals: Develop charts, graphs, and tables as specified in the template. Visual representations make trends, comparisons, and patterns easier to understand.
- Summarize Findings: Draft an executive summary to highlight key insights, including overall performance, major achievements, and notable trends. This section should provide a concise overview of the report’s main points.
- Address Challenges: Dedicate a section to challenges or issues encountered during the reporting period and describe actions taken to resolve them.
- Make Recommendations: Offer actionable recommendations based on your analysis to improve sales performance or address identified issues.
- Review and Finalize: Thoroughly review the completed report for accuracy and completeness, ensuring all data is correctly entered and the report flows logically.
- Distribute the Report: Share the finalized sales report with relevant stakeholders, such as sales teams, managers, or executives, through the appropriate channels.
Tips for Streamlining Your Sales Reporting Process

1. Use Pre-Defined Templates
- Start with a pre-defined sales report template excel to save time and ensure consistency across reports.
- Adjust templates to fit specific reporting needs or preferences.
2. Automate Data Entry
- Use Excel’s data import features to automatically pull in sales data from other systems or software.
- Leverage Excel formulas and macros to automate repetitive tasks and calculations.
3. Standardize Reporting Periods
- Define standard reporting periods (e.g., weekly, monthly) to make comparisons and trend analysis easier.
- Use Excel’s date filters and formulas to automatically update reports based on the selected period.
4. Implement Data Validation
- Use data validation rules to prevent incorrect data entry and ensure data accuracy.
- Enforce consistent data formats for dates, currency, and other fields.
5. Regularly Review and Update Reports
- Regularly review your sales reports for accuracy and relevance.
- Make necessary updates to templates and formats based on feedback and changing business needs.
6. Train Your Team
- Ensure that team members responsible for sales reporting are trained in using Excel effectively.
- Distribute guidelines and best practices for consistent and accurate reporting.
How to Choose the Best Format For a Sales Report?
You should consider a few factors that determine how effective your sales report format in Excel can be for you. You should choose Excel templates that best suit your business needs carefully, and here is how you can make that decision:
Decide How You Want the Sales Report to Look:
A sales report is more than just a document filled with your sales numbers. When someone, especially your analysts, starts reviewing it, they should be able to understand it easily. It should be eye-catching and simple to read, allowing anyone to feel confident while analyzing the numbers. For this, you can explore Vyapar’s collection of diverse sales report templates.


Take Your Audience into Consideration:
It is important to consider who will be reviewing your sales report. If sales team members need to present this report to the sales head, it must include a variety of KPIs. On the other hand, executives will prefer a more concise summary. Your CFO will focus on different aspects than your CEO. Your sales report should be designed to ensure that everyone on the receiving end is satisfied.
Include the Required Information:
When you look at various sales report templates on Vyapar or anywhere else, see what those include. Knowing who your audience is and what is expected from the report makes it easier to filter the specific information you need in the template.


Determine Both Current and Previous Financial Periods:
Given whatever factors you have analyzed above, you now need to determine how your information can be best conveyed. Is it best suited to annual sales report formats, monthly sales report formats, weekly sales report formats, or daily sales report formats? Then, compare the information of the current period with the previous equivalent period.
Presentation is the Key:
When it comes to your reports, the presentation is just as important as the numbers within it. Including graphs or other helpful visuals can assist everyone in understanding your numbers better. However, this pictorial representation must also be accurate. For instance, a line chart is ideal for showcasing revenues across all months when presenting an annual report. Vyapar can assist you in auto-generating such charts based on your data.

Key Features of an Effective Sales Report in Excel
Comprehensive Data Tracking
An effective sales report in Excel should comprehensively track all relevant sales data. This includes essential columns such as Date, Invoice Number, Customer Name, Product/Service, Quantity Sold, Unit Price, Total Amount, Payment Status, and Salesperson.
By capturing these details, the report ensures that all critical aspects of each transaction are recorded, providing a complete picture of sales activities and performance.
Customizable Templates
Flexibility is a key feature of an effective sales report. Customizable templates allow businesses to tailor the report layout and content to their specific needs.
Whether you need to adjust columns, add new fields, or modify existing ones, having a flexible template ensures that the report can evolve with changing business requirements, making it a valuable tool for various reporting needs.
Visual Data Representation
Visual elements like charts and graphs enhance the effectiveness of a sales report by making complex data easier to understand. Incorporating pie charts, bar graphs, and line charts can help illustrate sales trends, compare performance metrics, and highlight key insights.
Conditional formatting, such as color-coding high-value transactions or overdue payments, also helps quickly identify important data points and trends.
Summary and Analysis Features
An effective sales report should include summary and analysis features to facilitate data interpretation. Pivot Tables are particularly useful for summarizing large datasets and generating insights on sales performance by different categories, such as product, region, or salesperson.
Additionally, summary statistics such as totals, averages, and growth percentages provide a quick overview of overall sales performance and trends.
Advanced Filtering and Sorting
To streamline data analysis, advanced filtering and sorting options are essential. Filters allow users to easily narrow down large datasets based on specific criteria, such as time periods, products, or customer groups.
Sorting options enable users to view data in a meaningful order, such as by highest revenue or most recent transactions, making it easier to analyze and interpret sales performance.
Automation and Formulas
Automation and pre-defined formulas significantly enhance the efficiency of sales reporting. Using Excel’s built-in formulas to calculate totals, averages, and other metrics ensures accuracy and saves time.
Automation features, such as macros, can also simplify repetitive tasks, allowing for more efficient data processing and report generation. This helps maintain consistency and reduces the likelihood of errors in the reporting process.
Why Choose Vyapar Software For Sales Report Format in Excel?
Here is why Vyapar can prove to be the best choice for your business to create a sales report:
It offers a 7-day Free Trial:
You can always try Vyapar for selecting a sales report format in Excel, as it offers a risk-free 7-day trial before purchasing the subscription. The Accounting Software Vyapar is not just an advantage for your business but a comprehensive solution to cater to all your business requirements.
This trial allows you to test Vyapar’s sales report format in Excel sheets to determine if it meets your company’s needs. Additionally, you will discover that Vyapar stands out as one of the most professional billing software in the market, excelling in cost, integration, features, and more. Moreover, you do not need to worry about Vyapar adapting to your industry, as all its features are designed to be easily adaptable to any industry.
It Helps You Present a Professional Approach:
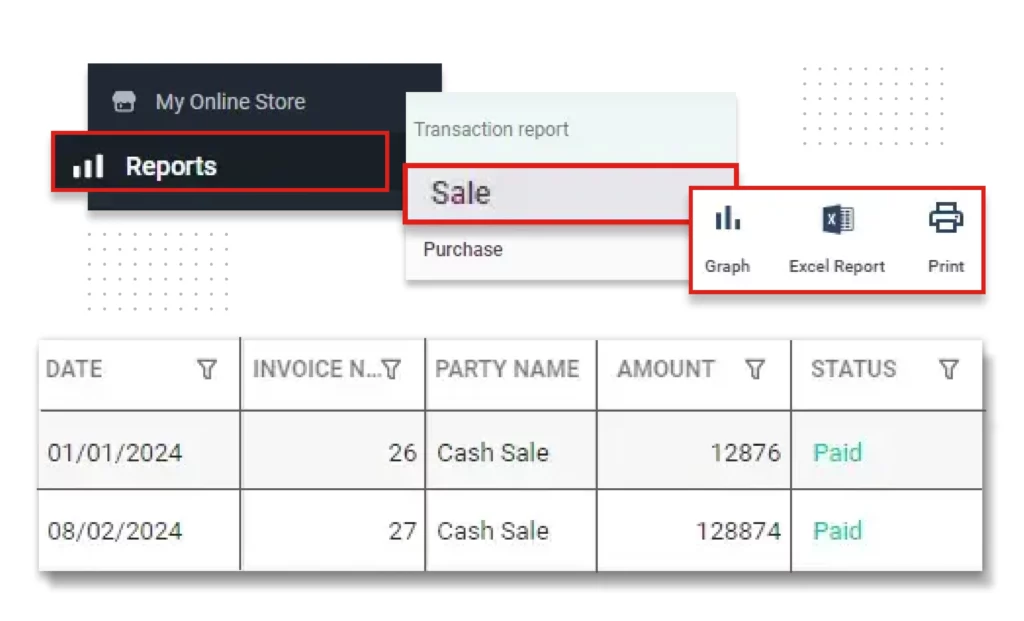
Vyapar provides a professional sales report format in Excel that helps portray a positive brand image to any concerned parties. While the sales report is typically used by your team, it may occasionally be required for investors as well. When presenting it to them, it is essential that they understand it thoroughly.
The professional sales report format in Excel by Vyapar not only organizes the numbers neatly but also includes graphs and other elements that make analysis significantly easier. Additionally, you can customize it to suit your company’s needs by incorporating your logo.
Make Better Decisions:
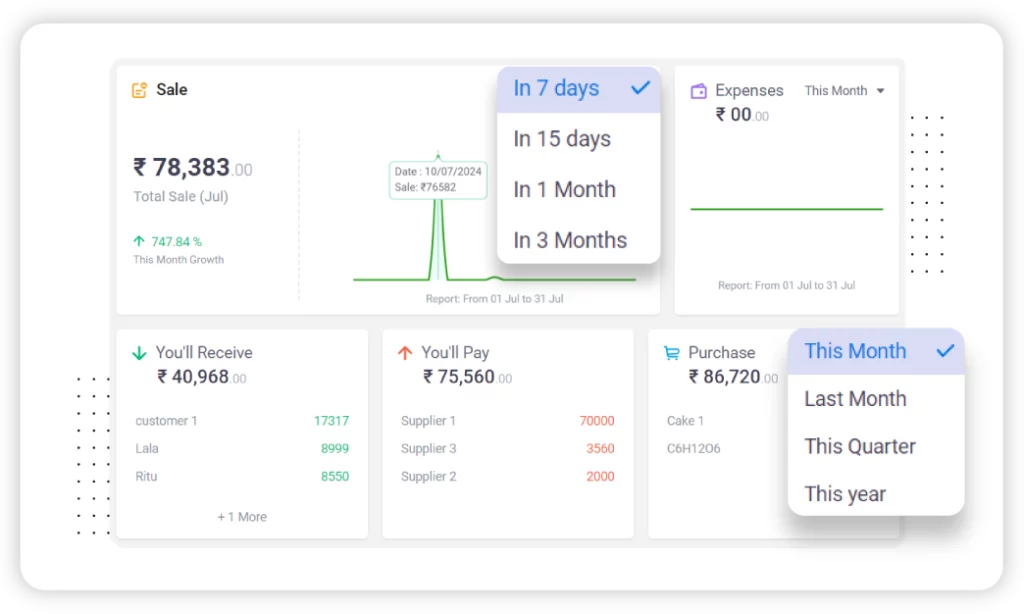
If you look beyond the sales report formats in Vyapar, you will find everything you need to track your business’s growth. Features like cash flow management and various invoice formats help you monitor all your transactions effectively. At any time, you can access the software to review your revenues, expenses, savings, and more. Additionally, the efficient and complete sales formats enable you to make better short- and long-term business decisions.
When all the activities in your business are consolidated in one place as analyzed data, making informed decisions becomes much easier. Vyapar serves as a one-stop platform to fulfill all your business requirements.
Plan Your Inventory With an Online/Offline Software:
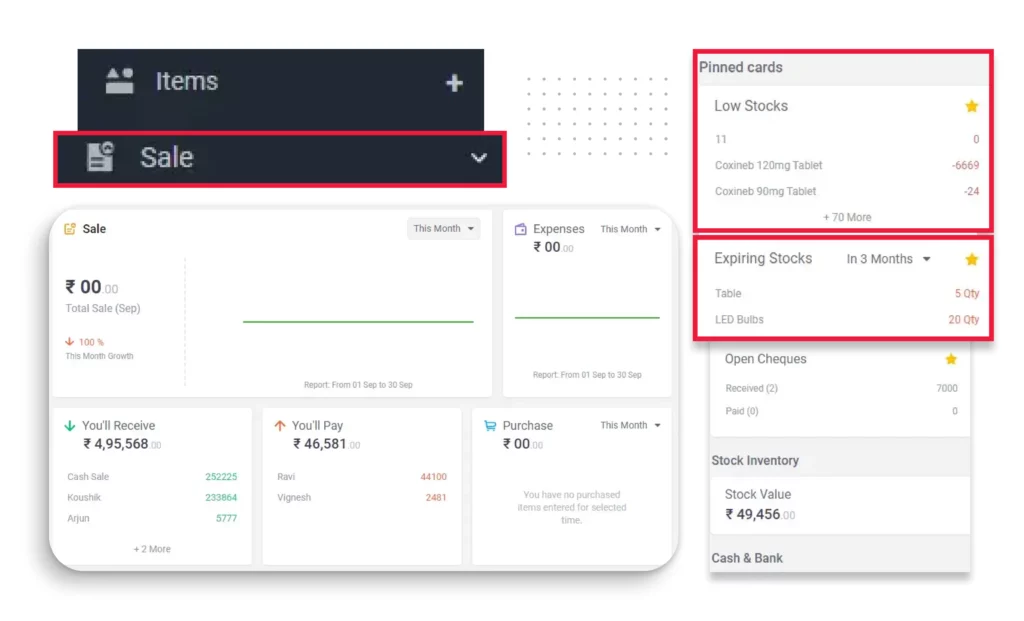
One of the many features of Vyapar is its ability to notify you when your inventory is running low. By regularly checking your Vyapar dashboard, you can prevent potential inventory discrepancies. This professional tool also assists in seamless warehouse inventory management. You can easily clear out your inventory whenever there are items you no longer need.
Furthermore, the best part about Vyapar is that it does not always require an internet connection. Many features, including downloading sales formats whenever needed, are available offline. This functionality is especially beneficial when operating in remote areas of India.
Multiple Payment Modes on Your Online Store:
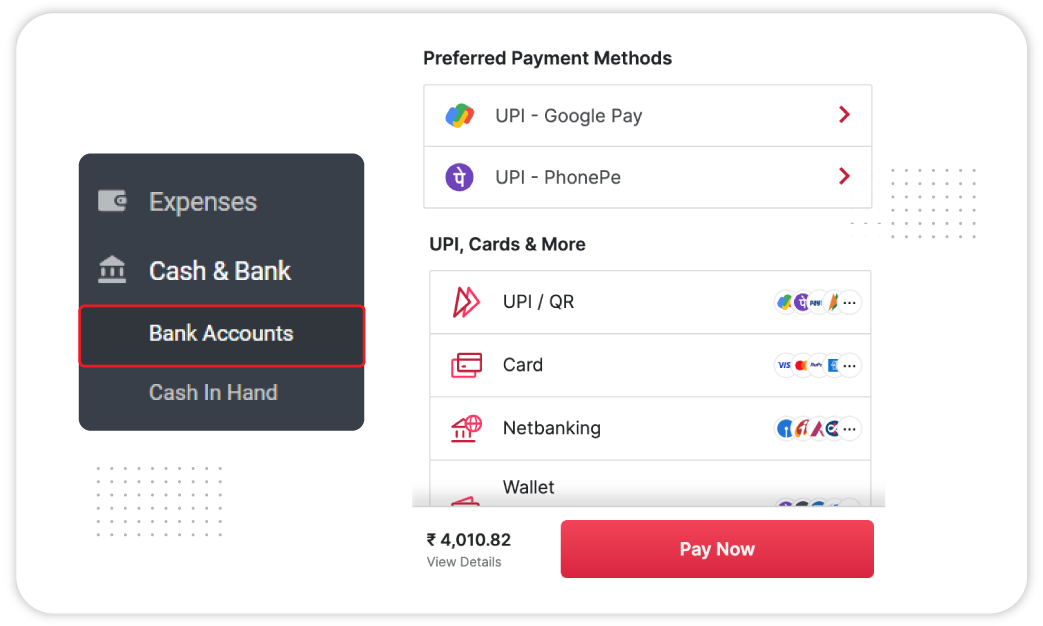
As mentioned earlier, Vyapar functions as an all-in-one platform for all businesses. Once you begin using it, you will discover its unique features over time. One such feature is the ability to open an online store with utmost convenience. You can quickly set it up by simply adding the products or services you want to showcase in the catalog.
Additionally, you do not need to worry about your customers struggling to locate a credit card every time they need to make a payment. Vyapar provides an all-payment mode feature for your online business. All standard payment modes accepted worldwide will be available for your customers.
Frequently Asked Questions (FAQs’)
For a business, it is important that it keeps track of all the sales that take place. By analyzing those, one can make informed decisions for future goals. A sales format in Excel helps you do that by putting all your numbers so that you get to a decision quicker and in a better way.
As mentioned above in the article, there are six steps using which you can prepare a sales report format in Excel. Using these, you only have to enter the relevant details and get the final valuable numbers.
For this, you have two options. You can either make a sales report from scratch or use a pre-existing format. Vyapar, amongst many other online software, offers the best sales report templates. These are not just easy to use but also customizable as per your specific business requirements.
The three report formats in Excel include compact, tabular, and outline formats. The compact is the default format for new tables in Excel, which can be changed from Report Layout Menu. Outline format presents data in a less-slim form. The tabular report puts the details in separate columns. Using Vyapar, you can use the best sales report template excel to create your reports.
Begin by gathering all relevant sales data, including total sales figures, units sold, and performance details by product, region, and salesperson. Ensure your data is accurate and up-to-date before you start.
Open your sales report template and start by entering basic information such as the report’s title, date, and reporting period. This provides context for your report and specifies the timeframe being analyzed.
Input detailed sales figures into the template, including total revenue, units sold, and breakdowns by product, region, or salesperson. Make sure to cover all relevant categories specified in the template.
Perform a comparative analysis by comparing current sales performance with previous periods or sales targets. Identify trends, strengths, and areas for improvement based on this comparison.
KPIs are metrics that help gauge sales performance. Calculate KPIs such as average deal size, conversion rates, and sales growth to assess the effectiveness of your sales strategies and identify areas for improvement.
Use the template’s features or external tools to create charts, graphs, and tables that illustrate trends and patterns in your sales data. Visuals help make complex data more understandable and actionable.
Share the finalized report with relevant stakeholders, such as sales teams, managers, or executives. Use appropriate channels to ensure that the report reaches all intended recipients.


